When people think about investing, the word “risk” usually dominates the conversation.
You’ve probably asked yourself:
“What if I lose money? What if I invest at the wrong time?”
But here’s something most people overlook:
Risk is not absolute — it’s a function of time.
At Boring Investment, we dove deep into the historical data of the S&P 500 and found that if you invest with a long-term mindset — and use the right strategy — risk virtually disappears.
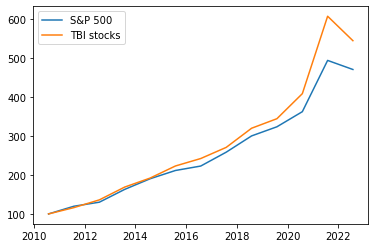
We have used S&P 500 index instead of Boring Investment stocks because of historical information availability (for S&P 500 data starts in 1950). However, in the article linked we compare S&P 500 index returns with Boring Investment strategy to show how you can beat the market when you don’t invest in “sexy” companies.
At the end of this article you’ll understand why we conclude that, if a robust investment strategy is followed, financial risk is almost zero when you invest for a sufficient number of year and forget to try to time the market.
The Analysis: How Often Would You Have Lost Money in the S&P 500?
We analyzed data from 1950 to 2024 using two approaches:
- Lump Sum: investing all at once at the beginning of the period.
- Dollar Cost Averaging (DCA): investing gradually over time (daily, weekly, monthly, depending on the holding period).
We tested different investment horizons — from 1 day to 20 years — and calculated the percentage of time each strategy resulted in negative returns.
🔻 Percentage of Negative Periods – Lump Sum (investing all at once at the beginning of the period)
| Holding Period | % of Losses |
|---|---|
| 1 day | 46.25% |
| 5 days | 43.09% |
| 1 month | 38.20% |
| 1 year | 25.59% |
| 5 years | 15.15% |
| 10 years | 6.09% |
| 15 years | 0.00% |
| 20 years | 0.00% |
The longer your holding period, the lower the chance of losing money.
After 15 years, there’s no historical precedent for a loss.
What Happens When You Use Dollar Cost Averaging (DCA)?
Here’s where it gets even better.
With DCA, where you invest periodically (investing same amount across time, e.g. monthly), the probability of loss drops significantly across all timeframes.
| Holding Period | Lump Sum (%) | DCA (%) |
|---|---|---|
| 1 day | 46.25% | 46.25% |
| 5 days (DCA is applied daily) | 43.09% | 41.90% |
| 10 days (DCA is applied daily) | 40.82% | 39.44% |
| 1 month (DCA is applied weekly) | 38.20% | 37.02% |
| 3 months (DCA is applied weekly) | 33.28% | 31.18% |
| 6 months (DCA is applied weekly) | 29.33% | 27.24% |
| 1 year (DCA is applied monthly) | 25.59% | 21.65% |
| 3 years (DCA is applied monthly) | 14.12% | 11.26% |
| 5 years (DCA is applied monthly) | 15.15% | 6.65% |
| 7 years (DCA is applied monthly) | 7.24% | 0.48% |
| 10 years (DCA is applied monthly) | 6.09% | 0.00% |
| 15 years (DCA is applied monthly) | 0.00% | 0.00% |
| 20 years (DCA is applied monthly) | 0.00% | 0.00% |
🔵 Bottom Line: DCA Reduces Risk — Almost to Zero at 7 Years, and Literally to Zero After That
Dollar Cost Averaging doesn’t just reduce risk — it crushes it.
By 5 years, DCA already cuts your chance of loss in half compared to Lump Sum.
By 7 years, the percentage of negative periods drops to just 0.48%.
Why isn’t 7 years holding period zero? Two years explain it all: 1980 and 1981.
Out of all the data from 1950 to 2024, only two years — 1980 and 1981 — led to negative 7-year DCA returns.
Here’s what happened:
- Inflation was out of control in the late 1970s, reaching over 14%.
- The U.S. Federal Reserve, under Paul Volcker, raised interest rates above 20% to fight inflation.
- This triggered two consecutive recessions in 1980 and 1981-82.
- Markets struggled for years under tight monetary policy and slow economic recovery.
As a result, investors who started DCA in 1980 or 1981 experienced subdued returns over the following 7 years — just enough to end slightly negative.
But think about it — that’s 2 years out of 75.
In other words: 97.3% of the time, 7-year DCA investments were positive, and 100% of the time at 10 years or more.
How Many Years Actually Had Negative Periods?
| Holding Period | Years Analyzed | Negative Years / Frequency – Lump Sum | Negative Years / Frequency – DCA |
|---|---|---|---|
| 1 year | 75 | 48 (64%) | 35 (47%) |
| 3 years | 75 | 21 (28%) | 13 (17%) |
| 5 years | 75 | 20 (27%) | 8 (11%) |
| 7 years | 75 | 11 (15%) | 2 (3%) |
| 10 years | 75 | 11 (15%) | 0 (0%) |
| 15 years | 75 | 0 (0%) | 0 (0%) |
| 20 years | 75 | 0 (0%) | 0 (0%) |
DCA slashes the number of years with negative outcomes — and makes long-term investing incredibly safe.
📊 Visualizing the Risk


Most losses happen during specific crises:
- The stagflation of the 1970s
- The Dot-com bubble (2000)
- The 2008 financial crisis
- The 2020 COVID crash
But if you stayed invested long enough, the market always recovered — and rewarded your patience.
Now, let’s add an important layer to our analysis, how about returns?
Full Results: Negative Returns & Annualized Performance
| Holding Period | DCA % Negative | DCA Mean | DCA P25 | DCA P50 | DCA P75 |
|---|---|---|---|---|---|
| 1 day | 46.26% | 7.8% | -102.7% | 12.4% | 127.6% |
| 5 days | 41.91% | 7.8% | -40.1% | 15.5% | 61.1% |
| 10 days | 39.49% | 7.9% | -24.1% | 14.2% | 45.4% |
| 1 month | 37.06% | 7.9% | -13.0% | 12.7% | 33.4% |
| 3 months | 31.28% | 7.8% | -4.5% | 10.1% | 23.5% |
| 6 months | 27.43% | 7.7% | -1.8% | 9.9% | 18.9% |
| 1 year | 21.95% | 7.7% | 1.3% | 8.8% | 16.7% |
| 3 years | 11.73% | 7.5% | 3.6% | 8.6% | 11.4% |
| 5 years | 7.12% | 7.5% | 2.5% | 8.2% | 11.2% |
| 7 years | 0.53% | 7.3% | 3.2% | 8.3% | 10.7% |
| 10 years | 0% | 7.1% | 3.7% | 7.5% | 10.4% |
| 15 years | 0% | 7.0% | 5.2% | 6.7% | 9.4% |
| 20 years | 0% | 6.8% | 5.1% | 6.8% | 8.3% |
🏦 How Does This Compare to “Risk-Free” Treasury Bonds?
Let’s say the average 10-year Treasury Bond yields ~4% annually. It’s considered “risk-free” because of government backing.
But here’s the thing:
- At 10 years, the S&P 500 with DCA never lost money historically.
- And not only that — the median annual return was 7.5% (DCA), almost double the bond yield.
- Even at P25 (worst quartile), returns were around 3.7%, almost matching bonds with equity upside.
Conclusion? Over long horizons, the stock market becomes practically “risk-free” in outcome, but with far better returns.
The real “risk” is not time — it’s short-term thinking.
Investing Risk = Time. Period.
This leads to a crucial insight:
Investment risk isn’t about volatility. It’s about time.
If there are zero 10-year periods with negative DCA returns, how risky is investing, really?
Almost inexistent I would say.
The Real Question Isn’t “What’s Your Risk Tolerance?”
It’s this:
What’s your investment time horizon?
If you can ride out short-term noise, you don’t need to fear risk.
Time is your best hedge.
Investing Isn’t About Timing. It’s About Enduring.
You won’t predict the market.
But you don’t have to.
All you need is a plan, consistency, and the discipline to hold through downturns.
At Boring Investment, we help you:
- Invest safely and consistently, with minimal effort.
- Use data, not emotions.
- Let compound interest and time do the heavy lifting.
Ready to invest the boring (but effective) way?
👉 Try our Investment Platform to invest wisely theboringinvest.com
👉 Subscribe for more no-fluff, data-backed insights in the form below


0 Comments