A good friend of mine suggested me to read “The Little Book That Beats The Market”, almost immediately I felt attracted by the content and simplicity of the book. This reading was the first step in the creation of this website (hereinafter TBI), theboringinvest.com.
This publication is a technical document explaining how we obtain the top-ranked stocks in our website. I read the book several times end-to-end and in pieces in order to not miss any detail of the calculation.
Formula and financial ratios
We use an API in python to download the financial statements from US stocks, information from approximately 2.000 companies is retrieved. This data is processed to transform quarter income statements and balance sheet into TTM figures (last 4 quarters of information), which are the better reflection of the current financial situation of the stocks. And in TBI we agree with Piotroski and are convinced that:
“financial reports represent both the best and most relevant source of information about firm’s financial condition”
Piotroski 2002.
To apply Greenblatt approach we just need the following financial attributes:
- EBIT, or in other words Operating Income (Loss).
- Invested Capital, calculated as Net Working Capital + Net Fixed Assets (minus excess cash), usually referred as tangible capital employed.
- Enterprise Value, calculated as market capitalization + net interest-bearing debt (Short-term debt+Long-term debt-Cash and cash equivalents and short-term investments)
- Current ratio, meaning Current Assets / Current Liabilities, in order to filter out companies with limited liquidity.
It’s not the purpose of this article to explain why each of those financials should be used, we encourage the reader to see the Appendix of the book in case it’s interested in understanding why EBIT instead of EBITDA or Enterprise Value instead of simply market capitalization, etc.
With these simple financial values we can already implement the investment strategy suggested by the author, following the next steps:
- Exclude stock with limited liquidity. We use a current ratio of 1.5 as the filter, as this is an industry common practice. Exclude also stocks with negative Equity or Invested Capital.
- Companies with Earning Yield (EBIT/Enterprise Value, hereinafter EY) higher than 20% have been excluded. As this may indicate that the previous year or the data being used are unusual in some way.
- Assign rank from 1 to N (number of stocks available) from higher to lower EY.
- Do the same for ROIC (EBIT/Invested Capital)
- Assign the 50% weight on each rank to calculate the overall ranking.
- Select the top 30, 20 or 10 stocks from this ranking.
With these 6 easy steps you’ll be applying the same strategy approach as the one recommended by a master in finance.
In our dashboard we decided to add some value to this very famous investment strategy proposed by Greenblatt. To do so, we changed the first condition of excluding stocks with limited liquidity by a filter on the TBI financial health score (a minimum of 90 out of 100 is requested).
The score was designed to rank companies based on their financial strength looking at: leverage, liquidity, profitability, solvency and size. The weights on those drivers were assigned applying a logistic regression method using more than 10 years of bankruptcy data.
Backtesting of investing approach
In TBI we back-test every investment strategy. In the case of “The Magic Formula”, we take 30 stocks at a given month and hold it for 12 month.
At the end of the 12-month period we “sell” the stocks and “ buy” the new set of selected stocks with the available cash balance.
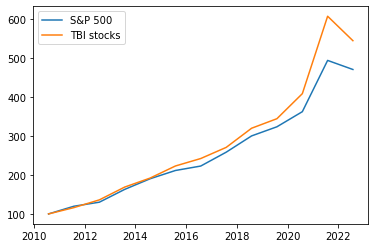
The figure below shows how the strategy has performed for the last 10 years starting at a value of 100 in 2012.

In the figure you can easily detect the drop in the market due to COVID-19 in the portfolio value of march 2020.
All these returns are above S&P 500 index return for the same 10 years period. Average annual return are in the range of 14%-16%, excluding march that shows an average of 20% due to the outlier return in 2021 (COVID-19 market recovery).
TBI financial health score
Now, we want to show the effect of including the TBI financial health filter in the performance of returns.
First we want to assess wether the score is a good driver to select stocks for investment or not, to do so we will check the annual returns over the last 12 years changing the floor of financial score from 0 to 90. Second, we will compare the performance of the filter 90 on TBI financial score to the method proposed by Greenblatt of excluding stocks with limited liquidity (i.e. current ratio lower than 1.5).


Independently of the market cap. filter and the period that is considered (i.e. 2011- 2023, 2019–2023 and 2014–2018), the score shows power of good differentiation between good and bad investments. The average annual return is higher as the score filter gets higher. This gives some confidence in the use of the score to select stocks.
When comparing the average annual returns with the filter suggested in Greenblatt’s book (excluding stocks with limited liquidity), the filter of 80 for the score seems to obtain similar performance, but the filter of 90 in the score beats the simple current ratio filter in almost all the samples and periods. With the exception of very large capitalizations where the liquidity ratio gets a similar output.
As a conclusion, TBI score shows good discriminatory power for investments in the last 12 years of data and works specially good for lower capitalizations. This is the case due to the fact that TBI score looks at the financials on more angles than just liquidity and has been developed following a robust methodology.
Final remarks
Regardless of the good performance observed in the back-test, it’s worth noting that “The Magic Formula” has a very promising name, but there is nothing magic in the approach, losses can still occur. Invest at your own risk.
For more information about performance of returns of TBI top-ranked stocks and it’s comparison to S&P 500 index, read the article: “TBI top-ranked stocks vs S&P 500 index”.


0 Comments