During the last years The Boring Investment ranking showed better returns than S&P 500. Beating the market is possible if a robust and data-driven approach is followed.
In this article we analyze the performance of The Boring Investment strategy, based on selecting the top-ranked stocks from our dashboard, vs. the market (represented as usual by the S&P 500 index).
To be precise, when we say “selecting the top-ranked stocks”, we are referring to select top 30 stocks from our dashboard which consists of companies showing some indications of being bargain, good quality and financially strong. And holding those stocks for a period of 12 month. Then, the new value of the portfolio is used to purchase the new top 30 stocks, and so on …
Although for simplification and for this backtesting exercise purposes we simulated the buy of all 30 stocks and S&P index in one day for the entire year, remember that, as we mention repeatedly in the web, dollar-cost-average (not buying at one single point in time but splitting the investments into more periodical exercise, e.g. monthly or quarterly) tends to show better results. Results using dollar-cost-average might be even higher than the ones showed in this article.
For more information about how this TBI rank is created please read our article about Greenblatt’s magic formula.
We consider this analysis is important for a number of reasons:
- To gain confidence on an investment strategy;
- To understand what are the plausible and expected annual returns and volatility;
- To assess if the strategy is worthwhile or simply it would make more sense to buy an ETF that follows S&P 500 index.
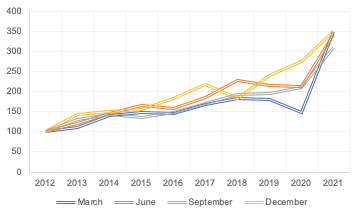
First we analyze the trend of values over time since 2010. The value of TBI selection grows quicker than S&P 500 index and reaches a higher value at the end of the 12 years period. Average TBI annual return is 16% vs a 14% annual return of the S&P 500 index.

The peak observed in 2021 is caused by the high returns obtained in both strategies for that year after COVID-19 (49% for TBI and 36% for S&P 500). This gap of 12 p.p. between the two returns, together with the differences in 2012 (8 p.p.) and 2020 (7 p.p.) are the years with the better TBI returns against S&P 500 index.
Although 2021 is a year with extremely good returns, it’s not the only one, for example 2013 is a year with returns of 24-25%, but this cannot be seen from the plot. The main reason why 2021 is easily recognized in the plot, it’s due to compound effect, smaller values in early years are obfuscated by the later years with higher nominal values; which makes almost impossible to see the amazing returns obtained in the first years of the analysis. For this reason, we created the following table to have a more fare conclusion.
In terms of annual returns per year since 2010, these are the two set of returns:

As can be seen, TBI selection beats S&P 500 in 6 out of 12 years, losses in 5 and gets almost same return in 1 year (2019). The sum of the ‘Difference’ column is 20%, meaning that in the last 12 years TBI return has been 20 percentage points higher, and the average difference is +1.7% (meaning that TBI selection is on average 1.7 p.p. above S&P 500 returns, which is not a negligible difference once you sum it up over a number of years).
When TBI beats the market it does it by an average of 6%, and when it is defeated by the market it losses by an average of -3%.
We now show the differences in returns but splitting the period into sub-periods of 5 years, to check if the 12 years better TBI performance is just by chance or is somehow independent of the selection of the period:

TBI returns are higher in all 5-years periods except one that it’s almost equal.
Conclusion
Regardless of which investment strategy you follow, the most important part is that you do it. To obtain a better result than the market is not as difficult as to have the discipline and patience that any investment exercise requires. It doesn’t really matters if you get a 16% or a 14% annual return as long as it’s not 0%.
If at the end of the day you managed to obtain good returns (even if those are lower than S&P 500 index), you can consider it a success. As you had achieved to fulfill your commitment of saving, investing and wait for a quite long period of time, through good and bad years.
We consider that TBI not only helps to achieve good investment returns but also, and maybe more importantly, it helps to make the investment exercise more fun and enjoyable that just buying an index. Making it easier to follow your saving and investment goals, which is as we said earlier the most important and difficult part.
Now on the analyses performed in this article, we showed that returns are consistently higher when buying top-ranked stocks than just S&P 500 index. We consider that this happens because the market is sometimes quite irrational, specially is moments of euphoria (buying even when prices are significantly high) or depression (selling when prices are considerably low).
As we showed in the plot, a 1.7 percentage point average higher annual return is not negligible, in particular when considering a meaningful period of time and the compound effect. At the end of the 12 years period tested here, the value of the portfolio of top-ranked stocks is 16% higher than the value of the S&P 500 portfolio.


0 Comments